
GTO poker charts: what they are and how to use them
Updated October 10, 2026 By Poker Skill How we built this GTO chart
| A | K | Q | J | T | 9 | 8 | 7 | 6 | 5 | 4 | 3 | 2 | |
|---|---|---|---|---|---|---|---|---|---|---|---|---|---|
| A | AA always raise | AKs always raise | AQs always raise | AJs always raise | ATs always raise | A9s always raise | A8s always raise | A7s always raise | A6s always raise | A5s always raise | A4s always raise | A3s always raise | A2s always raise |
| K | AKo always raise | KK always raise | KQs always raise | KJs always raise | KTs always raise | K9s always raise | K8s always raise | K7s always raise | K6s always raise | K5s always raise | K4s sometimes raise | K3s sometimes raise | K2s sometimes raise |
| Q | AQo always raise | KQo always raise | QQ always raise | QJs always raise | QTs always raise | Q9s always raise | Q8s always raise | Q7s always raise | Q6s always raise | Q5s sometimes raise | Q4s sometimes raise | Q3s fold | Q2s fold |
| J | AJo always raise | KJo always raise | QJo always raise | JJ always raise | JTs always raise | J9s always raise | J8s always raise | J7s always raise | J6s sometimes raise | J5s fold | J4s fold | J3s fold | J2s fold |
| T | ATo always raise | KTo always raise | QTo always raise | JTo always raise | TT always raise | T9s always raise | T8s always raise | T7s always raise | T6s sometimes raise | T5s fold | T4s fold | T3s fold | T2s fold |
| 9 | A9o always raise | K9o always raise | Q9o sometimes raise | J9o sometimes raise | T9o sometimes raise | 99 always raise | 98s always raise | 97s always raise | 96s always raise | 95s sometimes raise | 94s fold | 93s fold | 92s fold |
| 8 | A8o always raise | K8o sometimes raise | Q8o fold | J8o fold | T8o fold | 98o sometimes raise | 88 always raise | 87s always raise | 86s always raise | 85s sometimes raise | 84s fold | 83s fold | 82s fold |
| 7 | A7o always raise | K7o fold | Q7o fold | J7o fold | T7o fold | 97o fold | 87o fold | 77 always raise | 76s always raise | 75s always raise | 74s fold | 73s fold | 72s fold |
| 6 | A6o always raise | K6o fold | Q6o fold | J6o fold | T6o fold | 96o fold | 86o fold | 76o fold | 66 always raise | 65s always raise | 64s sometimes raise | 63s fold | 62s fold |
| 5 | A5o always raise | K5o fold | Q5o fold | J5o fold | T5o fold | 95o fold | 85o fold | 75o fold | 65o fold | 55 always raise | 54s always raise | 53s fold | 52s fold |
| 4 | A4o sometimes raise | K4o fold | Q4o fold | J4o fold | T4o fold | 94o fold | 84o fold | 74o fold | 64o fold | 54o fold | 44 always raise | 43s fold | 42s fold |
| 3 | A3o sometimes raise | K3o fold | Q3o fold | J3o fold | T3o fold | 93o fold | 83o fold | 73o fold | 63o fold | 53o fold | 43o fold | 33 always raise | 32s fold |
| 2 | A2o sometimes raise | K2o fold | Q2o fold | J2o fold | T2o fold | 92o fold | 82o fold | 72o fold | 62o fold | 52o fold | 42o fold | 32o fold | 22 always raise |
- Always raise
- Sometimes raise
- Fold
- 43.3% of hands
- 22+
- 22 and every pair above it
- ATs+
- ATs and every suited ace with a higher kicker, up to AKs
- s, o
- suited, offsuit
GTO preflop chart example: 6-max button opening range
43.3% of hands raised always or sometimes
6-max cash game, about 100 big blinds deep, action folded to you.
Always raise (33.0% of hands): 22+, A2s+, K5s+, Q6s+, J7s+, T7s+, 96s+, 86s+, 75s+, 65s, 54s, A5o+, K9o+, QTo+, JTo
Sometimes raise (10.3% of hands): K4s, K3s, K2s, Q5s, Q4s, J6s, T6s, 95s, 85s, 64s, A4o, A3o, A2o, K8o, Q9o, J9o, T9o, 98o
Fold: everything else
Free. No email or account needed.
Drill these spots in the app
Poker Skill turns these spots into short daily reps and tells you why an answer was right. Free forever, no wagering.


GTO preflop charts are ranges a solver produced for one exact situation. The label tells you where the numbers came from and what they assume, and the assumptions are the whole story: get them right and the chart is a strong default, get them wrong and you are following a map of a different table.
The short version
- A GTO chart is a solver's answer to one exact situation, not a universal rule.
- The chart carries assumptions: table size, stack depth, raise sizes, and opponents playing well.
- Solvers play some hands at partial frequencies, which is why real charts have a fuzzy edge.
- When the table breaks the assumptions, the chart stops being the best play available.
What makes a poker chart "GTO"?
A chart earns the label when its ranges come out of software that approximates an equilibrium: a strategy that cannot be beaten by any counter-strategy, given a fixed set of conditions. That is what GTO means, and a solver is the software that finds it. Nobody sat down and decided K9s should open from the cutoff. A machine played the spot against itself until neither side could improve, and the chart is a snapshot of where it landed.
The conditions are not decoration. A solve is built for a specific number of players, a specific stack depth, a specific rake, and a specific menu of bet sizes that the person running it chose in advance. Change any of those and the equilibrium moves. Every hand in Poker Skill's raise-or-fold lessons is held to fixed conditions the same way, dealt at a six-seat table 100 big blinds deep. A chart labeled GTO for a 6-handed 100 big blind cash game is not a GTO chart for your 9-handed home game, your 30 big blind tournament stack, or a table where everyone opens to 5 big blinds. It is still a chart. It is no longer the equilibrium for the game in front of you.
This is the part that gets skipped when the word appears on a product page. GTO is not a quality rating. It is a statement about where the numbers came from and what was assumed while making them. The free solver answers on this site print those assumptions for every spot they cover: the format, the stack depth and the bet sizes the solution allowed.
How to read a GTO preflop chart
Here is a teaching example, simplified enough to print but honest about its edge. It is a button opening range for a 6-handed cash game around 100 big blinds deep, with the action folded to you.
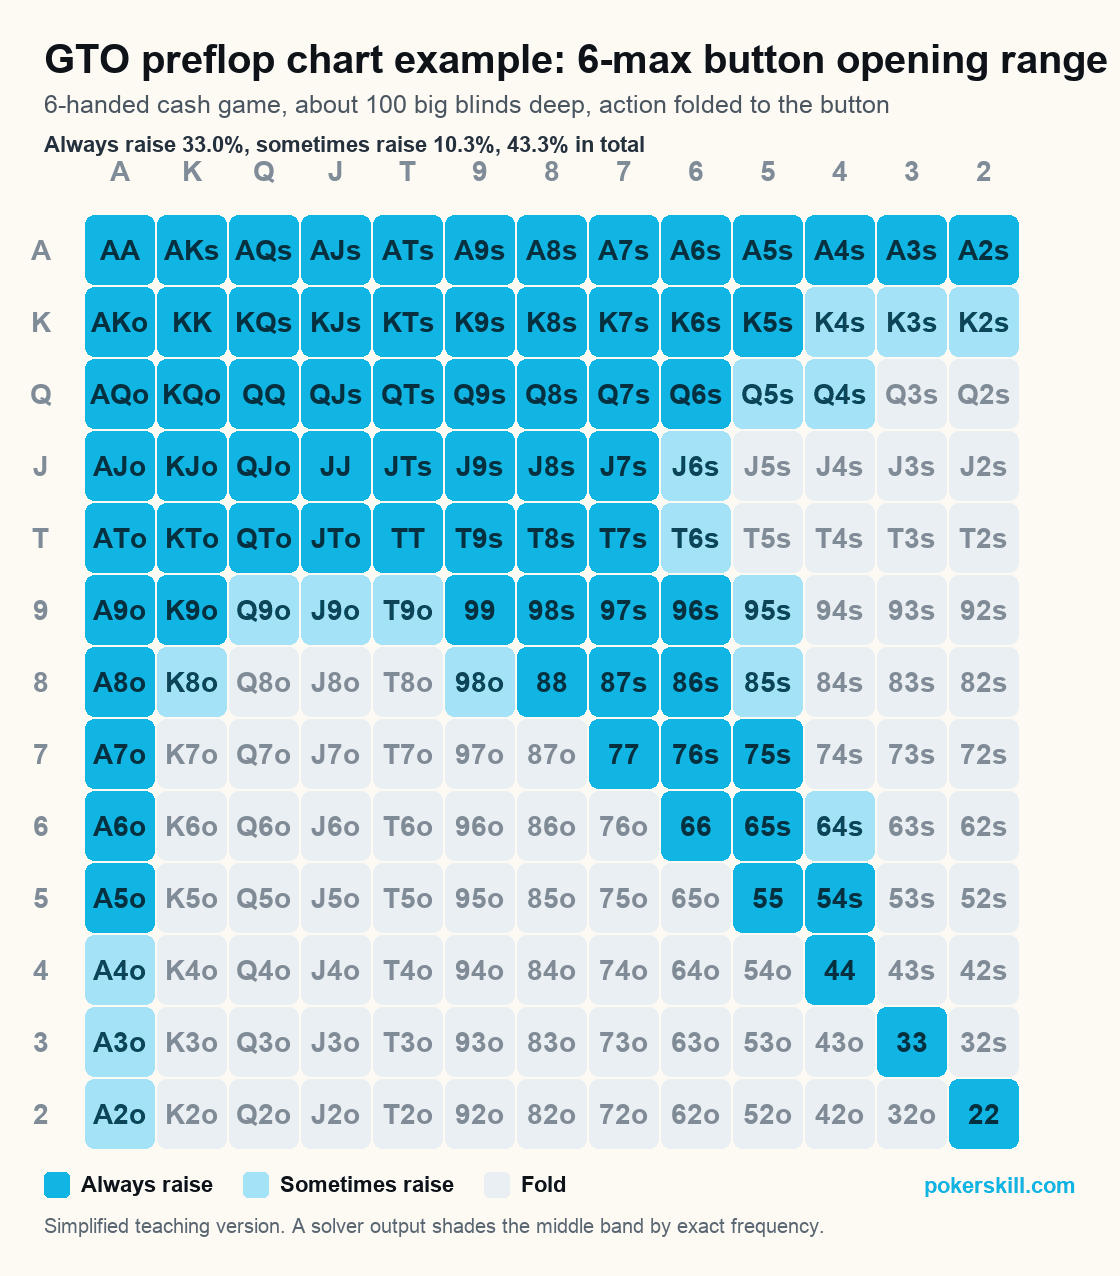
Three things to notice, and the third is the one that separates a solver chart from a chart somebody wrote by hand.
The grid is every starting hand. Pairs run down the diagonal, suited hands sit above it, offsuit hands below. Your two cards are in exactly one box.
The range is wide because the seat is good. Raising four hands in ten looks reckless written down. Two players are left, you act last on every street that follows, and the button leaks money by folding hands that would have made money, not by playing too many.
The edge is fuzzy, not sharp. The pale band is our stand-in for where a solver mixes. It does not say raise K4s. It says raise K4s some of the time and fold it the rest, because a hand played the same way every time becomes readable. Solver output is full of these mixed frequencies, which is exactly why raw solver charts are hard to use at a live table. Rounding a mix to always or never costs a little and buys you a decision you can make in four seconds.
| A | K | Q | J | T | 9 | 8 | 7 | 6 | 5 | 4 | 3 | 2 | |
|---|---|---|---|---|---|---|---|---|---|---|---|---|---|
| A | AA always raise | AKs always raise | AQs always raise | AJs always raise | ATs always raise | A9s always raise | A8s always raise | A7s always raise | A6s always raise | A5s always raise | A4s always raise | A3s always raise | A2s always raise |
| K | AKo always raise | KK always raise | KQs always raise | KJs always raise | KTs always raise | K9s always raise | K8s always raise | K7s always raise | K6s always raise | K5s always raise | K4s sometimes raise | K3s sometimes raise | K2s sometimes raise |
| Q | AQo always raise | KQo always raise | QQ always raise | QJs always raise | QTs always raise | Q9s always raise | Q8s always raise | Q7s always raise | Q6s always raise | Q5s sometimes raise | Q4s sometimes raise | Q3s fold | Q2s fold |
| J | AJo always raise | KJo always raise | QJo always raise | JJ always raise | JTs always raise | J9s always raise | J8s always raise | J7s always raise | J6s sometimes raise | J5s fold | J4s fold | J3s fold | J2s fold |
| T | ATo always raise | KTo always raise | QTo always raise | JTo always raise | TT always raise | T9s always raise | T8s always raise | T7s always raise | T6s sometimes raise | T5s fold | T4s fold | T3s fold | T2s fold |
| 9 | A9o always raise | K9o always raise | Q9o sometimes raise | J9o sometimes raise | T9o sometimes raise | 99 always raise | 98s always raise | 97s always raise | 96s always raise | 95s sometimes raise | 94s fold | 93s fold | 92s fold |
| 8 | A8o always raise | K8o sometimes raise | Q8o fold | J8o fold | T8o fold | 98o sometimes raise | 88 always raise | 87s always raise | 86s always raise | 85s sometimes raise | 84s fold | 83s fold | 82s fold |
| 7 | A7o always raise | K7o fold | Q7o fold | J7o fold | T7o fold | 97o fold | 87o fold | 77 always raise | 76s always raise | 75s always raise | 74s fold | 73s fold | 72s fold |
| 6 | A6o always raise | K6o fold | Q6o fold | J6o fold | T6o fold | 96o fold | 86o fold | 76o fold | 66 always raise | 65s always raise | 64s sometimes raise | 63s fold | 62s fold |
| 5 | A5o always raise | K5o fold | Q5o fold | J5o fold | T5o fold | 95o fold | 85o fold | 75o fold | 65o fold | 55 always raise | 54s always raise | 53s fold | 52s fold |
| 4 | A4o sometimes raise | K4o fold | Q4o fold | J4o fold | T4o fold | 94o fold | 84o fold | 74o fold | 64o fold | 54o fold | 44 always raise | 43s fold | 42s fold |
| 3 | A3o sometimes raise | K3o fold | Q3o fold | J3o fold | T3o fold | 93o fold | 83o fold | 73o fold | 63o fold | 53o fold | 43o fold | 33 always raise | 32s fold |
| 2 | A2o sometimes raise | K2o fold | Q2o fold | J2o fold | T2o fold | 92o fold | 82o fold | 72o fold | 62o fold | 52o fold | 42o fold | 32o fold | 22 always raise |
- Always raise
- Sometimes raise
- Fold
- 43.3% of hands
Always raise (33.0% of hands): 22+, A2s+, K5s+, Q6s+, J7s+, T7s+, 96s+, 86s+, 75s+, 65s, 54s, A5o+, K9o+, QTo+, JTo
Sometimes raise (10.3% of hands): K4s, K3s, K2s, Q5s, Q4s, J6s, T6s, 95s, 85s, 64s, A4o, A3o, A2o, K8o, Q9o, J9o, T9o, 98o
Fold: everything else
One cell, two charts
The gap between a solver’s answer and a printable one fits inside a single box. Take K4s, one hand from the pale band on the chart above.
What a solve says about a mixed box
Raise and fold
An answer with two actions in it, at whatever split the solve lands on. That is a mixed strategy: more than one action at the same decision point, chosen because a hand played the same way every time becomes readable.
What this printable chart says
Raise
One action, because a printed grid cannot hold two and a person at a live table has about four seconds. We round the box and we label the rounding rather than hiding it, which is what the pale band on the chart is for.
The same starting hand, K4s: an answer that contains two actions, and a printable answer that contains one.
How much of the button’s range sits in that fuzzy band is worth seeing, because it is the size of everything this simplification decides for you.
Free GTO preflop chart
This is the GTO preflop chart example from the section above, and it is free to save or print. It is a button opening range for a 6-handed cash game around 100 big blinds deep, with the action folded to you. No solver made it: it is our own button opening range from the preflop charts, with its edge shaded the way a GTO chart marks a mix. What makes it printable is the simplification. A mixed strategy plays the same hand more than one way at the same decision point, and a printed grid cannot do that, so the pale band is rounded to a single action and labelled honestly.
If you came for the charts rather than the label, they are one click away and there is no email gate. The free preflop charts cover every seat in 6-max and full ring plus a facing-a-raise chart. Opening ranges by position gives each seat its own grid, including the blinds. Short stack in a tournament is a different tool: use the push/fold charts.
GTO chart vs simplified chart: what you actually need
Most players comparing charts are really asking whether the free simplified one is good enough. Usually it is, and the reason is not charity. A mixed-frequency chart you execute badly is worth less than a rounded chart you execute correctly, and below the higher stakes almost nobody is losing money because their button range was a few hands off.
| Approach | Where it comes from | What it costs | Who it suits |
|---|---|---|---|
| Full solver chart | A solve of one exact spot, mixed frequencies included | Hard to memorize, harder to execute, wrong if the spot differs | Players studying a specific recurring spot in depth |
| Simplified chart | The same solve, rounded to always or never | A small amount of theoretical value | Almost everyone, almost all of the time |
| Exploitative adjustment | Your read on the specific players at your table | Unbalanced, and wrong if the read is wrong | Anyone sitting with players who make obvious mistakes |
The three are not rivals. The equilibrium chart is the baseline you start from, the simplification is how you carry it, and the exploit is what you do once a player at the table shows you something. Poker writers who work with solvers say the same thing: use the chart as a default and adjust as circumstances require.
How to use a poker chart
A chart is a memory aid, not a rulebook. Read it away from the table, where you have time to take in the whole shape of it. Check yourself against it after a session instead of during one, then drill the hands on the edges, because the middle of a range is rarely the part anyone gets wrong. Keep the assumptions in view too: every chart was built for a table size, a stack depth and a raise size. When the game in front of you breaks those, the chart is a starting point and your read is the answer. A chart is also only the lookup half of learning, and the tools that drill the other half are compared in our roundup of the best poker training apps.
When GTO charts fail
A chart is a strategy for a game. When the game in front of you is not the one the chart was built for, following it is no longer optimal, it is just consistent. Three table conditions do that, and none of them is exotic: in a live game all three happen every session.
| What you are looking at | The assumption it breaks | What to do instead |
|---|---|---|
| A limper in front of you | That the pot is unopened | Isolate wider against a limper who folds, tighten and raise for value against one who never folds |
| The table opens to five big blinds | That a raise costs about two and a half | Defend a smaller range, because the price on every call has changed |
| A player who folds to every 3-bet, or calls with anything | That opponents are playing near equilibrium | 3-bet more against the folder, bet for value and stop bluffing against the caller |
Limpers and odd raise sizes break the assumptions
Both are assumptions the chart made silently before you sat down, and the rows above tell you what to do about each. Worth adding: a limped pot is not just a wider decision, it is a bigger raise, because the dead money in front of you changes the price of taking it down. You can practice the case in Poker Skill's limper lessons, which run from the button isolating a single limper to a capstone on the whole limped pot.
Your opponents are not playing GTO either
Equilibrium strategies are built to be unexploitable, which is a defensive property: they do not go looking for a player’s mistakes. That is why the third row above costs you money in both directions. The chart is not wrong in either case. It is answering a question about a table you are not sitting at.
Common GTO chart mistakes
The failures we see most often are not subtle. Using a 6-max chart at a 9-handed table, where the extra players make every early seat worse. Using a 100 big blind chart on a 25 big blind tournament stack, where playability matters less and raw equity matters more. Using an opening chart after somebody has already raised. Treating a mixed cell as a pure raise because that is the half you remembered. And the biggest one: following the chart for an hour against a player who has shown you three times exactly how they lose money. Most of those come from reading a chart rather than drilling the decision, which is the gap the best poker training apps are built to close.
Check yourself. You are on the button in a 6-handed game, 100 big blinds, folded to you, and you look down at Q♦ 4♦. The chart above is open in front of you. Raise, fold, or something else?
Show the answer
Raise, and notice which kind of answer you just got. Q4s sits in this chart’s pale band, so the printable answer is a rounding rather than a certainty, which means it is one of the boxes a read on the table is allowed to overrule. If the two blinds behind you never fold, this is a hand to drop; if they fold too much, it is a hand to raise happily. A box in the always-raise block does not give you that permission.
Practice beyond the chart
A chart handles the one street where a lookup table can hold the whole answer. The other three are where the money moves, and no chart is coming to help you on the turn. Poker Skill drills decisions rather than lists: you pick, and you find out why the answer was what it was. Free forever, no wagering.
How we built this GTO chart
The sample is our button opening range from the preflop charts. The pale band at its edge, 10.3% of hands, is an illustration of how a GTO chart marks a mixed strategy, so the chart gives no frequency for those hands.
GTO chart FAQ
Are GTO charts allowed at the table?
Online, the site's rules decide, and big sites ban it: GGPoker forbids charts of any kind during play, and PokerStars forbids GTO solutions while its software is running. Live is a different question. In tournaments the rule is flat: the Tournament Directors Association bans strategy tools at the table outright, charts and apps named directly, with no live-hand exception to work around. Cash games run on house rules instead, so practice varies room to room, and the realistic expectation is that you will be asked to put it away. We wrote up the detail in what electronics are actually allowed at a poker table. Away from the table, in your notes, on the break, after the session: study all you like.
Do you need a solver to use GTO charts?
No. Running a solver and reading a chart are different activities, and the second one is what almost everyone needs. A solver earns its keep when you have a specific recurring spot you want to understand, not when you want to know which hands open from the cutoff, because that answer has already been computed and shared many times over. If you are weighing the tools against each other, the comparison of a trainer versus a solver is the page for that decision.
Are free GTO charts accurate?
The free ones are usually simplified, and simplified means deliberately lossy: the mixed frequencies get rounded, the rare branches get dropped, and what survives is the part that matters most. That is a feature for a player and a limitation for a study tool, and the honest test is whether the chart says which game it was built for. A chart that names its table size, its stack depth, and its raise size is being straight with you. A chart that just says GTO across the top is selling something.
What is the difference between a GTO chart and a preflop chart?
Nothing structural. Both are grids of starting hands with actions attached. GTO describes where the numbers came from, so the only real question is whether the source solved the game you are playing. Read the assumptions before you trust the colours.