Equity Distribution in No-Limit Texas Hold’em
What equity distribution means
Equity distribution is how equity is spread across every hand inside a range on a specific board, not the single average equity number you see at the top of a calculator. The average tells you how the range does on the whole. The distribution tells you which combos do the heavy lifting, which combos are coin flips, and which combos are basically dead. Same range, same board, two different ways of looking at it; only the second one is enough to plan a strategy.
A useful first pass:
- A top-heavy distribution has a big block of high-equity combos at the top and a long tail of low-equity combos at the bottom, with not much in between.
- A flat or condensed distribution has most combos clustered around the middle, with no tall block at the top and no long tail at the bottom.
- Two distributions can share the same average equity and still want totally different bet sizes, bluff frequencies, and pot sizes.
Related terms
- Equity
- Range
- Range vs range
- Range advantage
- Nut advantage
- Polarized range
- Condensed range
- Board texture
Distribution vs equity, range advantage, and range vs range
These ideas overlap so often that people stop seeing the differences. They are not the same thing.
| Concept | What it tells you | What it does NOT tell you |
|---|---|---|
| Equity (one hand) | The % chance one specific hand wins at showdown | What happens with the rest of your range |
| Range advantage | Which side has more average equity on this board | How that average is spread across hands |
| Range vs range | The general habit of comparing two distributions | Which axis of the comparison is driving the spot |
| Equity distribution | The shape of equity across every hand in a range | Which single combo you happen to hold right now |
Range advantage is one number per side. Equity distribution is the curve behind that number. You can have the higher average and still have the worse shape, and the shape is often what decides the right plan.
Why averages mislead
Averages collapse a range to one summary statistic. That statistic is fine for a quick read on who has more equity, but it hides three things that matter for sizing and frequency:
- How thick the top of the range is. A side with a big block of sets, two pair, and overpairs can credibly bet big for value. A side with the same average equity but no nutted block has to use smaller sizes because nothing in the range wants to play a giant pot.
- How much air is at the bottom. A range with a long tail of unpaired, unimproved hands has natural bluff candidates. A range without that tail has to bluff with hands that already have showdown value, which usually does not pay off.
- Whether the middle is thick. A condensed range stuffed with medium pairs and weak top pair wants to keep pots small and bluff-catch. Big bets into a condensed range punish exactly the hand class the caller is built around.
The strategic shorthand: a top-heavy distribution wants polarized sizing — big bets, more bluffs, bigger pots. A flat or condensed distribution wants smaller sizes, more checks, and a bluff-catching plan. Same average equity, opposite plan.
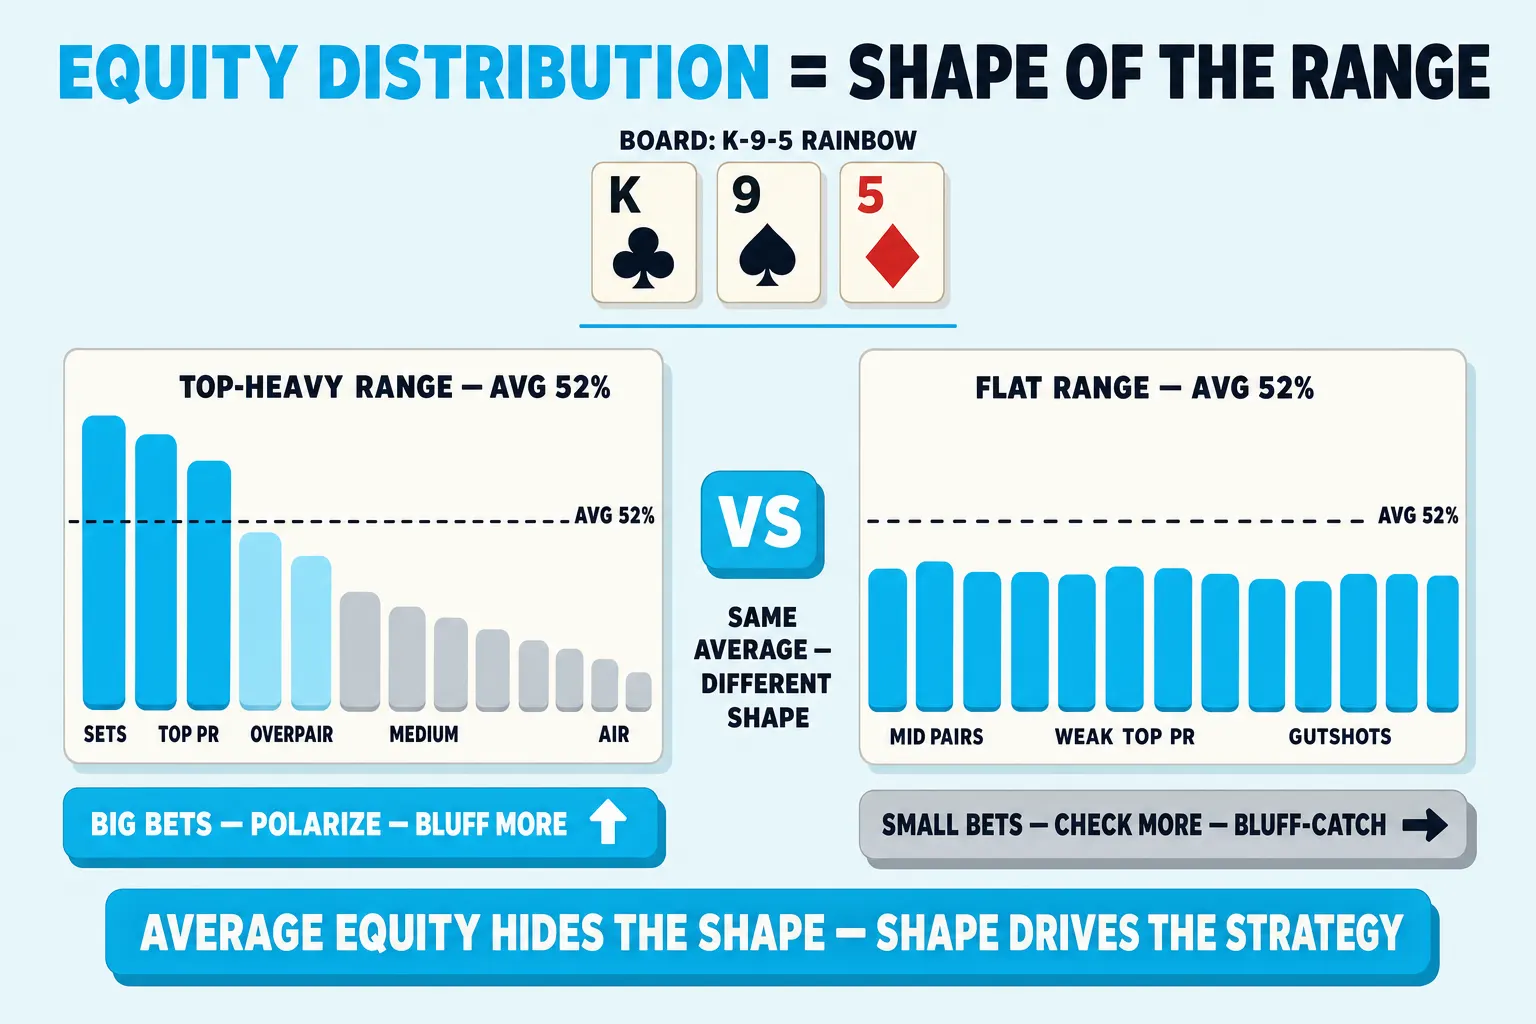
Example: top-heavy vs flat on K♣ 9♠ 5♦
This is illustrative, not a solver output. The goal is to show how two ranges with similar average equity can have very different distributions on the same board.
Setup: 100bb, 6-max, K♣ 9♠ 5♦ rainbow flop. Two simplified ranges to compare:
- Range A (top-heavy): sets (KK, 99, 55), top pair with strong kickers (AK, KQ, KJs), some overpairs (QQ-JJ-TT), and a tail of unpaired air (AQ, AJs, suited connectors that bricked).
- Range B (flat): middle pairs (88-66), some weak top pair (KTs, K9s for second pair), gutshots, and a few overcard hands. No sets, no overpairs.
Imagine the two ranges land near the same average equity number on this exact flop — not because the math always lines up, but because the shape is what we are comparing, not the headline number.
What the distributions look like, hand by hand:
- Range A. A small block of combos sits at very high equity (sets, top pair top kicker). A medium block sits around 60-70% (overpairs). A long tail of combos sits below 30% (the air that did not connect). The combos at the top can bet for value at almost any size; the combos at the bottom are clean bluff candidates.
- Range B. Most combos sit clustered between 40% and 60%. There is no high-equity block to lean on, and no low-equity tail to bluff with. The whole range is one wide medium band.
Different distributions, similar average. Different plans:
- Range A wants a polarized line: bigger bets with the top block, bluffs from the tail, and a smaller-size or check option for the medium hands. The thick top makes big bets credible. The thick tail keeps the bluff-to-value ratio honest.
- Range B wants smaller bets and more checks. Nothing in the range wants to play a big pot — the top of the range is barely better than the middle, and there is no air to bluff with. Trying to over-bet from Range B turns medium hands into forced bluffs and runs them into anything stronger.
The lesson is the one the table above already teases: the same average equity is consistent with two completely different strategies, and the distribution is what tells you which one to run. A sharper version of this comparison sits in range advantage (overall equity edge) and nut advantage (top-of-range edge); equity distribution is the curve that produces both.
How board texture reshapes the distribution
The same range has a different distribution on every flop. A few patterns that show up over and over:
- Dry, high-card boards like K-7-2 rainbow tend to top-heavy a preflop raiser’s range. The raiser keeps overpairs, top-pair-good-kicker, and broadway draws; everything else is air. The distribution stretches.
- Connected, low boards like 6-5-4 flatten the raiser’s range. The big pairs are still ahead of one pair, but there are now sets, two pair, straights, and combo draws on the defender’s side. The defender’s distribution stretches; the raiser’s compresses.
- Paired boards can collapse a range to “boats and air.” Most middling combos lose meaningful equity because the third card to the board now beats them; the few combos with trips or a full house jump up.
Reading the shape of the new distribution after each card is a habit worth building. The mean shifts a little; the shape often shifts a lot.
Common mistakes
1) Reading only the headline equity
A calculator returns 52%. You feel comfortable barreling. You should not yet — 52% with a thick block of nutted combos plays nothing like 52% with everything wrapped around the middle. The headline number is a starting point, not a plan.
2) Treating range advantage as enough
Range advantage tells you who has more average equity. It does not tell you whether the top of the range is dense enough to support big sizes, or whether the bottom is dense enough to support bluffs. Two players can have nearly identical range advantages and still want completely different sizings because their distributions are shaped differently.
3) Bluffing from a flat range
A range with no real air does not have natural bluff candidates. Trying to bluff from one means turning medium-strength hands into bluffs, which usually folds out worse and gets called by better. If the bottom of the distribution is mostly medium hands, the right plan is to check and protect the showdown value instead of forcing pressure that does not exist.
4) Sizing up from a top-heavy range without a tail
A range with a thick top but no tail of air is value-heavy and bluff-light. Sizing up still extracts from worse, but doing it without bluffs makes the line easy to read; opponents fold every hand that has to fold and call only with hands that beat your bluffs. The shape needs both ends to support polarized sizing.
FAQ
What is equity distribution in poker?
Equity distribution is how equity is spread across every hand in a range on a specific board, not the average equity number for the range as a whole. It describes the shape of the spread — how many combos sit at the top, how many sit in the middle, and how many sit at the bottom — and that shape is what drives bet sizing and bluff frequency.
How is equity distribution different from range advantage?
Range advantage is one number per side: who has more average equity on this board. Equity distribution is the curve behind that number. Two ranges can have the same average and very different curves, and the curve is usually what tells you whether to bet big, bet small, bluff more, or check.
Why do two ranges with the same average equity play differently?
Because the average hides the shape. A top-heavy range with nutted combos and air can credibly polarize: big bets for value, bluffs from the tail. A flat range packed with medium hands cannot — nothing wants a big pot and nothing has natural bluff candidates. Same average, opposite plan.
How does board texture change the distribution?
Every new card reshapes the curve. Dry, high-card boards tend to stretch a preflop raiser’s distribution by giving the top of the range room to stay ahead. Connected, low boards flatten that distribution because more of the defender’s hands catch up. Paired boards can collapse most of the range and leave only a thin top block. The mean shifts a little; the shape often shifts a lot.